
Visible High Low
Automatically marks the highest and lowest price in your visible chart area — updates in real-time as you scroll.
Download FreeHow it works
This indicator displays the highest high and the lowest low in the current timeframe. As you scroll through the chart in ATAS, the displayed high and low change in real-time. No lag, no manual drawing — just clean, automatic levels that are always relevant to what you're looking at.
Visible High Low is built for the ATAS order-flow platform
New to ATAS? Open ATAS Web in your browser – footprint, volume tools and 240+ indicators, no installation. For live trading and custom indicators like ours, use the free desktop demo or compare plans.
Partner links: if you get ATAS through them, we earn a commission at no extra cost to you – that's what keeps the indicators free. ATAS Web is a prototype with delayed data; broker connection and custom indicators require ATAS Desktop – the ATAS quick-start guide gets you from download to first chart.
What can I use it for?
Trend Identification
Helps identify market trends by highlighting extreme price points in the visible timeframe. If highs and lows keep rising — you're in an uptrend. Both declining — downtrend.
Breakout Confirmation
When price breaks above the visible high or below the visible low, it signals that the current range is expanding. Use this to confirm breakout entries.
Stop-Loss Placement
Provides logical reference points for stop-loss placement. Place stops beyond the visible high (for shorts) or below the visible low (for longs) based on actual recent price action.
Support and Resistance
Identifies key support and resistance levels within the current visible range. These are levels where price already proved it reacts — making them natural reference points.
Settings
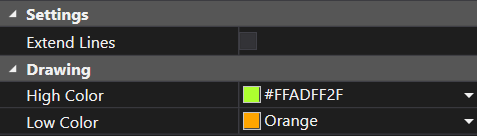
Extend Lines
Extends the high/low lines across the full chart width, making them easier to reference at a glance.
High Color
Customize the color of the high level line to match your chart theme.
Low Color
Customize the color of the low level line to match your chart theme.
Frequently Asked Questions
Why are the high and low not showing?
Make sure the indicator is properly applied to your chart and that you have enough visible data for the indicator to detect highs and lows.
What can I use this indicator for?
The indicator is useful for trend identification, breakout confirmation, stop-loss placement, and identifying support and resistance levels.
Get Visible High Low
Subscribe to download all indicators for free — including future updates.
New to ATAS? What ATAS is and which brokers work with it.
Free trading tools: Position Size Calculator · Risk/Reward Calculator · Session Times