
Delta and Cumulative Delta (CVD) Explained — and How to Use Them in ATAS
Delta is aggressive buying minus aggressive selling. Learn how bar delta and cumulative volume delta are calculated, what delta divergence means, why delta and price can disagree, and how to set it up in ATAS.
If the footprint chart is the microscope, delta is the one-number summary of what it shows. It answers a single question for any bar, session or level: who was more aggressive — buyers or sellers — and by how much?
What delta is
Delta = volume traded at the ask − volume traded at the bid.
- Trades at the ask are market buys (buyers crossing the spread).
- Trades at the bid are market sells.
A bar with 1,200 contracts at the ask and 800 at the bid has a delta of +400: net aggressive buying. Delta says nothing about passive participants — the limit orders that were hit or lifted — which is exactly why it must be read together with price.
Delta is usually displayed as a histogram under the chart (bar delta) and inside the footprint per price level.
Cumulative delta (CVD)
Cumulative Volume Delta adds up bar deltas over time, producing a running line — much like an equity curve of aggression. It is normally reset at the start of each session, so the line starts at zero and shows the net aggressive flow of the day; some traders also watch a non-resetting CVD for multi-day context.
Reading CVD is mostly about comparing its shape with price:
| Price | CVD | Reading |
|---|---|---|
| Makes a new high | Makes a new high | Buyers are aggressive and price follows — healthy trend |
| Makes a new high | Fails to make a new high | Bearish divergence: price rose on less aggression; passive buyers or short covering did the work — trend vulnerable |
| Makes a new low | Fails to make a new low | Bullish divergence |
| Flat | Rising strongly | Absorption: aggressive buying is being absorbed by passive sellers — often precedes a reversal down |
| Flat | Falling strongly | Aggressive selling absorbed by passive buyers |
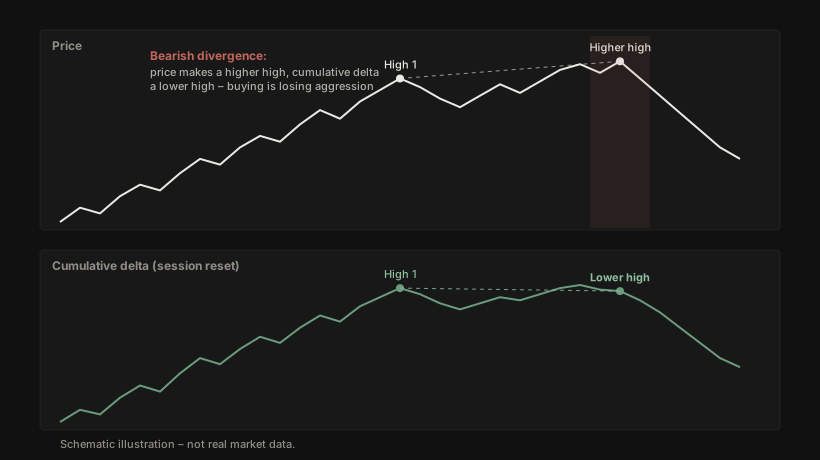
The last two rows are the most valuable and the least intuitive. Strongly positive delta with no price progress is not bullish; it means someone large is selling into the buyers without moving the market.
Why delta and price can disagree
Every trade has two sides, and only the aggressor is counted in delta. Price is set by the balance of aggressive orders against passive liquidity. Three situations create the famous “delta says up, price goes down”:
- Absorption — passive sellers keep refilling the offer; buyers exhaust themselves.
- Trapped traders — late aggressive buyers at the high have no one left to sell to; when they liquidate, their selling drives price down faster than their buying drove it up.
- Iceberg orders — a large order that shows only a small visible size and refills automatically; the footprint shows repeated volume at one level while price stalls.
This is why delta is a context tool, not a signal. Positive delta at a volume profile level where price also advances confirms the level is being accepted; positive delta with rejection at the same level is a warning.
Practical uses
- Confirming a breakout: a break of a session high on strongly positive bar delta and rising CVD is more trustworthy than one on flat delta.
- Timing entries at levels: wait for delta to flip at a volume profile level — sellers hitting bids at a POC turning into buyers lifting offers — rather than entering on the level alone.
- Divergence as an exit tool: for many traders CVD divergence is more useful for taking profit on an existing position than for initiating a counter-trend one.
- Session character: a CVD that grinds steadily in one direction all morning usually means a trend day; a CVD that oscillates around zero means balance.
Setting it up in ATAS
No ATAS yet? Delta and cumulative delta are among the 240+ indicators in ATAS Web – free in the browser, 15-minute-delayed data.
- Add the Delta indicator (bar delta histogram) below the chart; enable colouring by sign so positive and negative bars are distinguishable at a glance.
- Add Cumulative Delta; set the reset to Session for intraday work. Some traders plot it as a line, others as candles (open/high/low/close of delta within the bar) — candles reveal intrabar swings in aggression.
- In the cluster chart, switch the cell mode to Delta to see per-level delta inside the footprint.
- Our free Colored Data indicator can recolour any indicator panel by its value relative to zero — applied to the delta or cumulative delta panel, it turns sign changes into an instant visual cue.
Common mistakes
- Trading delta in isolation. Delta without a level and without price behaviour is noise.
- Comparing delta across instruments. +2,000 in ES is routine; +2,000 in a thin contract is enormous. Judge delta relative to the instrument’s typical range.
- Forgetting the reset. A CVD that was not reset at the session open carries yesterday’s flow; know which one you are looking at.
- Assuming delta equals institutional activity. Delta measures aggression, not size or identity. Large institutions mostly work passively — the footprint’s absorption patterns tell you more about them than delta does.
Frequently asked questions
Is delta available for stocks and crypto? Yes, wherever trades are tagged bid/ask by the feed. Quality varies: centralised futures data is cleanest; aggregated crypto feeds can be inconsistent.
What is a “good” delta divergence? One that occurs at a level (profile node, prior high/low, stacked imbalance) and is confirmed by price behaviour — for example a new price high with lower CVD, followed by a footprint bar that shows absorption at that high.
Delta vs. volume — which matters more? Volume tells you how much interest there was; delta tells you which side was aggressive. You need both: high volume with near-zero delta is a battle (and often absorption); high volume with strong delta is a decision.
Sources
- ATAS documentation: Delta, Cumulative Delta and cluster chart settings (help.atas.net).
- James Dalton et al.: Mind over Markets (Wiley, 2013) — auction framework for reading aggression against value.
- CME Group: Time & Sales and aggressor-side tagging in market data (cmegroup.com).
Educational content, not a trading recommendation.
Related free indicator: Colored Data — Customize the visual representation of any indicator — apply different colors based on value behavior relative to zero for instant trend recognition.
Recommended reading
- Mind over Markets — James Dalton · reading aggression against value
- Markets in Profile — James Dalton
- Order Flow Trading for Fun and Profit — Daniel Chen · delta and footprint in practice
Affiliate links: if you buy through them we earn a small commission at no extra cost to you.
Our indicators are built for the ATAS order-flow platform
New to ATAS? Open ATAS Web in your browser – footprint, volume tools and 240+ indicators, no installation. For live trading and custom indicators like ours, use the free desktop demo or compare plans.
Partner links: if you get ATAS through them, we earn a commission at no extra cost to you – that's what keeps the indicators free. ATAS Web is a prototype with delayed data; broker connection and custom indicators require ATAS Desktop – the ATAS quick-start guide gets you from download to first chart.
Continue learning: How to Read a Footprint Chart: Bid × Ask, Imbalances and Absorption · Volume Profile Explained: POC, Value Area and How to Trade It in ATAS · Order Flow Trading for Beginners: What It Is and How to Start
Get the indicators — free
Subscribe to download all ATAS indicators, including future updates and new guides.
Educational content only — not investment advice. Trading futures involves substantial risk of loss. See our disclaimer.