
Volume Profile Explained: POC, Value Area and How to Trade It in ATAS
What a volume profile shows, how to read point of control, value area and high/low volume nodes, the classic profile shapes — and how to set it up in ATAS.
A price chart tells you where price went. A volume profile tells you where the market actually did business — which prices attracted the most trading, which were passed through quickly, and where buyers and sellers agreed on value. That difference is why volume profile is the first tool most order flow traders add to their chart, and why it works on any market with real volume: futures, stocks, crypto.
What a volume profile is
A volume profile is a histogram of traded volume at each price level over a chosen period — a session, a day, a week, or any range you select. Instead of showing volume per time bar at the bottom of the chart, it shows volume per price, drawn horizontally along the price axis.
The idea comes from Market Profile, developed by J. Peter Steidlmayer with the Chicago Board of Trade in the 1980s. Market Profile organises time at price (how many 30-minute periods traded at each level); volume profile organises volume at price. Both rest on the same auction theory: markets move to find the price at which the most business can be done, spend time there, and move on when that price no longer attracts both sides.
The three things you read first
Point of Control (POC)
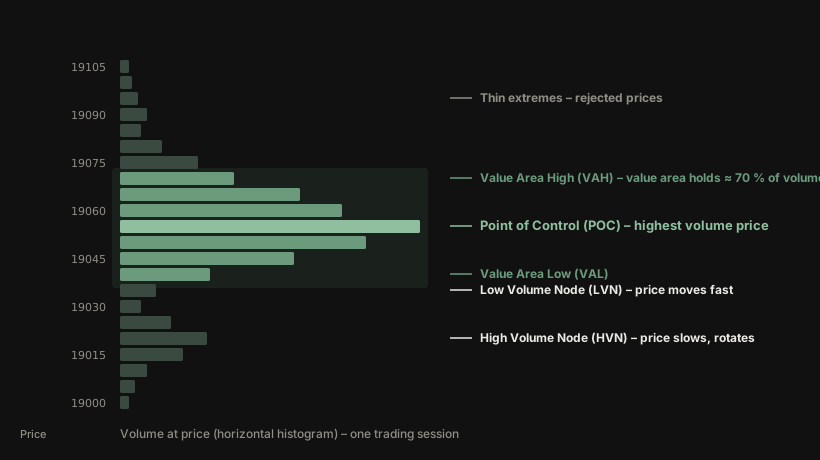
The POC is the single price level with the highest traded volume in the profile. It is the market’s best estimate of fair value for that period — the price where buyers and sellers were most willing to transact.
- A POC in the middle of the range says the market found value and rotated around it.
- A POC near the high or low says the market accepted new prices late in the session — often a sign of directional conviction.
- A POC from a previous session that price has not yet revisited (a naked or virgin POC) is one of the most widely watched targets in order flow trading.
Value Area (VAH / VAL)
The value area is the price range that contains roughly 70 % of the period’s volume, centred on the POC. Its upper edge is the Value Area High (VAH), its lower edge the Value Area Low (VAL). The 70 % convention comes from Market Profile, where it approximates one standard deviation of a normal distribution.
The value area answers one question: did the market accept or reject a price? Price trading inside value is accepted; price outside value is either being rejected (it snaps back in) or is building new value (it stays out and the next profile forms there).
High and Low Volume Nodes (HVN / LVN)
Beyond the POC, the profile has bumps and gaps:
- High Volume Nodes (HVN) are price zones with unusually heavy volume — places where the market spent time and both sides participated. Price tends to slow down and rotate when it returns to an HVN.
- Low Volume Nodes (LVN) are thin zones the market passed through quickly — nobody wanted to trade there. Price tends to move fast through an LVN, and an LVN often marks the edge between two areas of value.
A practical rule many traders use: HVNs are magnets, LVNs are accelerators.
Profile shapes and what they tell you
The overall shape of a session profile summarises the day’s auction:
| Shape | What it looks like | What it usually means |
|---|---|---|
| D-shape (normal) | Wide middle, narrow extremes | Balanced day — two-sided trade around a clear POC; expect rotation, fade the extremes |
| P-shape | Fat top, thin bottom | Buyers drove price up early, then the market accepted the higher level; often short covering or a trend day that paused |
| b-shape | Thin top, fat bottom | Mirror image — selling early, then acceptance lower |
| Double distribution | Two separate fat areas with a thin LVN between them | The market moved from one value area to another; the LVN between them is a key level |
| Thin / elongated | Little volume anywhere, long range | Trend day — one side in control all session; profile-based fades are dangerous |
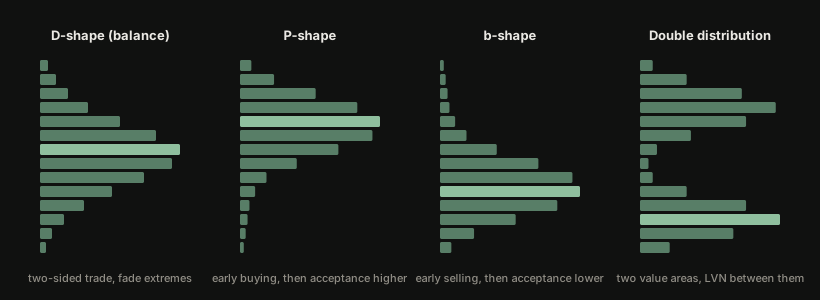
Shapes are not signals on their own. They are context: a P-shape after a long decline reads differently from a P-shape at all-time highs.
How traders actually use it
- Levels from yesterday: Previous session’s POC, VAH and VAL are drawn on today’s chart. Opening inside yesterday’s value suggests a rotational day; opening outside it and staying outside suggests a trend day. Dalton’s 80 % rule captures the classic play: if price opens outside value and then trades back inside and holds for two consecutive 30-minute periods, there is a high probability it rotates across the entire value area.
- Composite profiles: A profile over several days or weeks reveals the larger value areas and the LVNs between them — the map for swing entries and targets.
- Confluence with order flow: A volume profile level is a where; the footprint chart and delta are the when. Most order flow setups combine both: price returns to an HVN or a naked POC, and the footprint shows absorption or an imbalance at that level.
- Targets and stops: LVNs make logical targets (price accelerates into them) and logical stop placements (beyond the node, where the thesis is wrong).
Setting it up in ATAS
No ATAS yet? The volume profile and the cluster chart are available in ATAS Web – free in the browser, 15-minute-delayed data, ideal for practising what follows.
ATAS ships several profile indicators; the two you will use most:
- Volume Profile / Market Profile – add it from the indicator list. Key settings: the period (Session, Daily, Weekly, Composite, or Fixed range via the drawing tool), the value area percentage (70 % by default), and whether to show POC and value area lines extended to the right. Enable the extension so yesterday’s levels are visible on today’s chart.
- Cluster (footprint) chart with profile overlay – the cluster chart type can show the session profile on the right edge of the chart, which keeps the levels visible while you read the footprint.
Practical defaults for intraday futures: session profile with VAH/VAL/POC extended, a composite profile of the last five to ten sessions on a second chart, and a tick or volume chart with the footprint for execution. Our free Visible High Low indicator complements this by marking the extremes of whatever range you are looking at — useful when you scroll through composite profiles.
Common mistakes
- Trading the POC as a line, not a zone. Volume clusters; treat the POC as a band a few ticks wide, especially in thick markets.
- Ignoring the period. A session POC and a weekly POC answer different questions. Know which profile you are looking at.
- Fading extremes on trend days. If the profile is thin and elongated, the market is not in balance — value-area rules do not apply until it is.
- Using volume profile on illiquid instruments. The tool needs real, centralised volume. On markets with fragmented or unreliable volume data the profile is noise.
Frequently asked questions
Is volume profile the same as VWAP? No. VWAP is the volume-weighted average price of the period — a single line. The volume profile shows the distribution of volume across all prices. They are complementary: VWAP is often near the POC on balanced days and far from it on trend days.
Which period should a beginner use? Start with the session (regular trading hours) profile and the previous session’s levels. Add composites once you can read a single session confidently.
Does volume profile work for crypto? On exchanges with genuine volume, yes. Be careful with aggregated feeds that mix exchanges of very different quality.
Sources
- J. Peter Steidlmayer, Kevin Koy: Markets and Market Logic (Porcupine Press, 1986) — the origin of Market Profile and the value-area concept.
- James Dalton, Eric Jones, Robert Dalton: Mind over Markets (2nd ed., Wiley, 2013) — profile shapes, the 80 % rule, day types.
- CME Group: Market Profile educational materials (cmegroup.com/education).
- ATAS documentation: Volume Profile and Market Profile indicators (help.atas.net).
This guide explains a chart-reading method; it is not a trading recommendation.
Related free indicator: Visible High Low — Automatically marks the highest and lowest price in your visible chart area — updates in real-time as you scroll.
Recommended reading
- Mind over Markets — James Dalton · the standard text on Market Profile and value
- Markets in Profile — James Dalton · profiles across timeframes
- Steidlmayer on Markets — J. Peter Steidlmayer · from the inventor of Market Profile
Affiliate links: if you buy through them we earn a small commission at no extra cost to you.
Our indicators are built for the ATAS order-flow platform
New to ATAS? Open ATAS Web in your browser – footprint, volume tools and 240+ indicators, no installation. For live trading and custom indicators like ours, use the free desktop demo or compare plans.
Partner links: if you get ATAS through them, we earn a commission at no extra cost to you – that's what keeps the indicators free. ATAS Web is a prototype with delayed data; broker connection and custom indicators require ATAS Desktop – the ATAS quick-start guide gets you from download to first chart.
Continue learning: How to Read a Footprint Chart: Bid × Ask, Imbalances and Absorption · Delta and Cumulative Delta (CVD) Explained — and How to Use Them in ATAS · Order Flow Trading for Beginners: What It Is and How to Start
Get the indicators — free
Subscribe to download all ATAS indicators, including future updates and new guides.
Educational content only — not investment advice. Trading futures involves substantial risk of loss. See our disclaimer.