
How to Read a Footprint Chart: Bid × Ask, Imbalances and Absorption
The footprint (cluster) chart shows the volume traded at bid and ask inside every bar. Learn to read imbalances, stacked imbalances, unfinished auctions and absorption — and how to configure it in ATAS.
A candlestick compresses everything that happened in a bar into four prices. A footprint chart — ATAS calls it a cluster chart — opens the candle up and shows, for every price level inside the bar, how much volume traded at the bid and how much at the ask. It is the closest thing to watching the tape with a structure.
The term footprint was popularised by MarketDelta in the 2000s; the concept is generic and every serious order flow platform has a version of it.
What the numbers mean
Each cell of a footprint bar shows a pair of numbers at one price: bid volume × ask volume.
- Ask volume is volume that traded at the ask — buyers lifting the offer with market orders. It is read as aggressive buying.
- Bid volume is volume that traded at the bid — sellers hitting the bid with market orders. It is read as aggressive selling.
Every trade has a buyer and a seller; what the footprint records is which side was the aggressor — who crossed the spread to get filled. That is the whole point: price moves when one side is willing to pay up, and the footprint shows you where that happened.
Most platforms offer several footprint modes that colour the same data differently:
| Mode | Shows | Best for |
|---|---|---|
| Bid × Ask | Both numbers per level | Reading imbalances and absorption |
| Delta | Ask minus bid per level | Spotting where aggression flipped |
| Volume | Total volume per level | Finding the high-volume levels inside the bar |
| Imbalance | Highlights only levels that exceed the imbalance ratio | Fast scanning |
Imbalances: the core signal
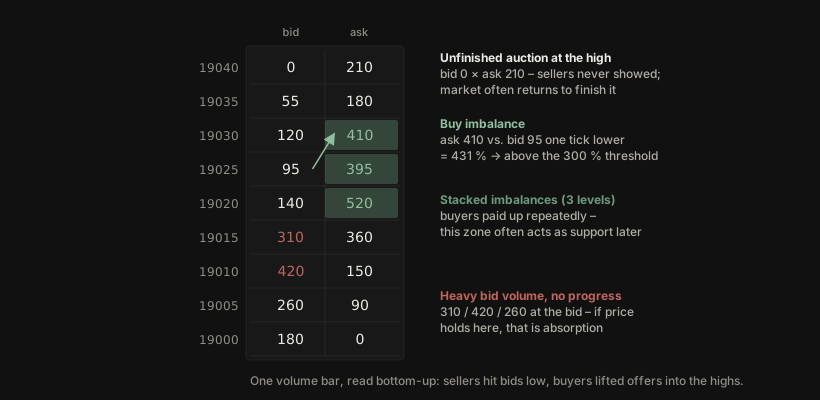
An imbalance is a level where one side’s aggression overwhelmed the other by a wide margin. The comparison is diagonal, not horizontal: ask volume at a price is compared with bid volume one tick lower, because a market buy at price P lifts the ask at P while a market sell at the same moment hits the bid at P − 1 tick.
- Buy imbalance: ask volume at P is at least N times the bid volume at P − 1 tick.
- Sell imbalance: bid volume at P is at least N times the ask volume at P + 1 tick.
The ratio N is configurable; 300 % (3 : 1) is the common default, and many traders raise it to 400–500 % in thick markets like ES to filter noise. Platforms mark imbalanced cells in colour.
Stacked imbalances — three or more consecutive imbalances on the same side — are the strongest form. A stack of buy imbalances marks a zone where buyers were willing to pay up repeatedly; if price returns there, it often finds support. A stack of sell imbalances often becomes resistance. These zones are among the most widely used footprint-derived levels.
Absorption: when aggression fails
The mirror image of an imbalance is absorption. Heavy aggressive volume hits a level — say, large ask volume, buyers lifting offers — and yet price does not move up. Something is absorbing the buying: passive limit sellers refilling the offer, often a large participant unwinding or building a position.
You recognise absorption by high volume with no price progress, typically at the high or low of a bar or at a known level from the volume profile. Absorption is one of the few order flow patterns that hints at the intentions of large passive traders — the ones the footprint otherwise cannot see because they never cross the spread.
A useful pairing: our Fuse Wick Marker flags candles with unusually long wicks — the price-action signature of rejection — so you can check the footprint of exactly those bars for absorption.
Unfinished auctions
At the very top of a bar, if the last price level shows both bid and ask volume (no zero on either side), the auction there is unfinished: the market did not fully exhaust buyers before turning. Traders treat unfinished auctions as levels price is likely to revisit to “complete” the auction. A finished high shows a zero on the bid side at the top — nobody was willing to sell higher — which is a clean rejection.
A simple reading routine
- Locate the level. Use the volume profile, a naked POC, a stacked imbalance from earlier, or a session high/low. The footprint is most informative at levels, not in the middle of nowhere.
- Watch aggression. As price reaches the level, is the aggressive side showing imbalances into the level (momentum) or is volume high without progress (absorption)?
- Confirm with delta. The bar’s delta should agree with the story: rejection at a high with negative delta is cleaner than rejection with strongly positive delta.
- Define the invalidation. If price accepts beyond the level and the footprint keeps printing imbalances in that direction, the level failed — that is the stop.
Setting up the cluster chart in ATAS
No ATAS yet? The bid/ask footprint is available in ATAS Web – free in the browser, no installation, 15-minute-delayed data.
- Chart type: choose Cluster (footprint) for the instrument; select the bar type — time, tick, volume or range. Many order flow traders prefer tick or volume bars because each bar then contains a comparable amount of activity.
- Cluster mode: start with Bid × Ask to learn, then switch to Delta or Imbalance mode for faster scanning.
- Imbalance settings: ratio 300 % as a starting point; enable stacked imbalances highlighting with a minimum of 3 levels.
- Profile on the right: enable the session profile in the chart settings so POC and value area stay visible next to the footprint.
- Font and colour: make the cells legible before anything else — a footprint you cannot read at a glance is worse than no footprint.
Common mistakes
- Reading every bar. The footprint is a microscope; use it at levels, not continuously.
- Confusing volume with direction. A big ask number means aggressive buying happened — not that price must rise. If it did not rise, that is absorption, and it argues the other way.
- Too low an imbalance ratio in thick markets. 300 % in ES produces constant “signals”. Raise the ratio until imbalances are rare enough to matter.
- Ignoring the bar type. Time-based footprints on a quiet lunch session show almost nothing; volume-based bars keep the information density constant.
Frequently asked questions
Is a footprint chart the same as a DOM / order book? No. The DOM shows resting limit orders that have not traded yet; the footprint shows executed volume and which side was aggressive. The DOM is intent, the footprint is fact.
Do I need tick data? Yes — a footprint is built from individual trades tagged as bid or ask. Your data feed must deliver that (Rithmic and CQG both do for CME futures; see our Rithmic vs CQG comparison).
Which markets are best to learn on? Liquid, centrally traded futures: ES, NQ, CL, GC, and the European equivalents (FDAX, FGBL). Avoid instruments with fragmented volume while learning.
Sources
- ATAS documentation: Cluster chart, imbalance and delta settings (help.atas.net).
- James Dalton et al.: Mind over Markets (Wiley, 2013) — auction theory underlying imbalance and unfinished-auction concepts.
- CME Group: Market data and time & sales specifications (cmegroup.com).
- MarketDelta (Trevor Harnett): origin of the “Footprint” chart term.
Educational content, not a trading recommendation.
Related free indicator: Fuse Wick Marker — Scans your chart for candles with unusually long wicks or tails — a key signal for price rejection at important levels.
Recommended reading
- Mind over Markets — James Dalton · auction theory behind imbalances and absorption
- Order Flow Trading for Fun and Profit — Daniel Chen · practical footprint reading
- Trading Order Flow — Yuri Kurbanov · ATAS-oriented introduction
Affiliate links: if you buy through them we earn a small commission at no extra cost to you.
Our indicators are built for the ATAS order-flow platform
New to ATAS? Open ATAS Web in your browser – footprint, volume tools and 240+ indicators, no installation. For live trading and custom indicators like ours, use the free desktop demo or compare plans.
Partner links: if you get ATAS through them, we earn a commission at no extra cost to you – that's what keeps the indicators free. ATAS Web is a prototype with delayed data; broker connection and custom indicators require ATAS Desktop – the ATAS quick-start guide gets you from download to first chart.
Continue learning: Volume Profile Explained: POC, Value Area and How to Trade It in ATAS · Delta and Cumulative Delta (CVD) Explained — and How to Use Them in ATAS · Order Flow Trading for Beginners: What It Is and How to Start
Get the indicators — free
Subscribe to download all ATAS indicators, including future updates and new guides.
Educational content only — not investment advice. Trading futures involves substantial risk of loss. See our disclaimer.